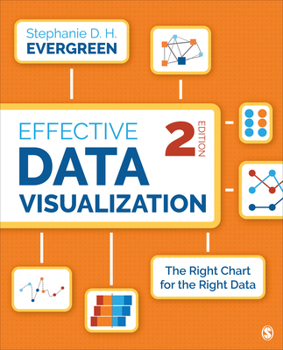
Effective Data Visualization: The Right Chart for the Right Data
Written by sought-after speaker, designer, and researcher Stephanie D. H. Evergreen, Effective Data Visualization shows readers how to create Excel charts and graphs that best communicate data findings. This comprehensive how-to guide functions as a set of blueprints--supported by research and the author's extensive experience with clients in industries all over the world--for conveying data in an impactful way. Delivered in Evergreen's humorous and approachable style, the book covers the spectrum of graph types available beyond the default options, how to determine which one most appropriately fits specific data stories, and easy steps for making the chosen graph in Excel. New to the Second Edition is a completely re-written chapter on qualitative data; inclusion of 9 new quantitative graph types; new shortcuts in Excel; and entirely new chapter on Sharing Your Data with the World which includes advice on using dashboards; and lots of new examples throughout. The Second Edition is also presented in full color.
Format:Paperback
Language:English
ISBN:1544350880
ISBN13:9781544350882
Release Date:May 2019
Publisher:Sage Publications, Inc
Length:352 Pages
Weight:0.89 lbs.
Dimensions:0.6" x 7.4" x 9.1"
Related Subjects
Business Business & Investing Computers Computers & Technology Social Science Social SciencesCustomer Reviews
0 rating


