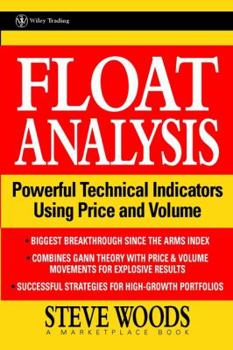
Float Analysis: Powerful Technical Indicators Using Price and Volume
A complete guide to trading with price, volume, and float Float Analysis explains how to use the Woods Cumulative Volume Float Indicator, the landmark concept in technical analysis that teaches the reader how to accurately determine when to purchase stocks. This groundbreaking book also contains all-new insights on how to understand and profit from these indicators, how support and resistance are redefined by this innovation, and how to implement these strategies into a high-growth portfolio. Steve Woods (Hyattsville, MD) is the Executive Director of FloatAnalysis.com and has written a number of articles for various journals including Technical Analysis of Stocks & Commodities . New technology and the advent of around the clock trading have opened the floodgates to both foreign and domestic markets. Traders need the wisdom of industry veterans and the vision of innovators in today's volatile financial marketplace. The Wiley Trading series features books by traders who have survived the market's ever changing temperament and have prospered-some by reinventing systems, others by getting back to basics. Whether a novice trader, professional or somewhere in-between, these books will provide the advice and strategies needed to prosper today and well into the future.
Format:Hardcover
Language:English
ISBN:0471215538
ISBN13:9780471215530
Release Date:April 2002
Publisher:John Wiley & Sons
Length:232 Pages
Weight:0.05 lbs.
Dimensions:0.9" x 6.3" x 9.3"
Customer Reviews
5 ratings
The preccision profit float indicator
Published by Thriftbooks.com User , 23 years ago
Uses float analysis to identify bottoms and tops, support and resistance, accumulation and distribution. Earlier systems used price chart formations like Head and shoulder, double tops and bottoms to identify support and ressistance lines. But his systems uses float analysis instead, the point is these earlier systems don't work without rising volume and can't identify tops in time before a reversal. However, looking cleary at his charts. between the support and resistance lines, you will notice these price chart formations. Using these two systems together will double signal a upward break or reversal. Still in discovery stages. I will add this trading systems. Since you can buy tradestation code if you dont have the time to write it.
The Precision Profit Float Indicator
Published by Thriftbooks.com User , 24 years ago
I find this book to be outstanding. It is a hard book to put down, you will want to read the whole book before you stop reading. You will want to buy an extra copy to give as a gift if you have a serious trading friend. This book is a classic and is a must read for anyone who wishes to study volume in regards to stock. The information given is unique. The book not only covers buy signals, but also covers sell signals. Woods reveals one of the best techniques I've ever seen for telling how to get out of volatile high momentum stocks on fast run ups. The book also gives very solid information on expected reversal, support and resistance levels.
Float Analysis is a great new research area.
Published by Thriftbooks.com User , 24 years ago
For several years, I always thought that there was a missing dimension to trading stocks and wondered how certain stocks go up so fast compared with others. When trading IPOs, one always looks at the stock's float because if it's very small, then the price move can be explosive in some cases.The first thing I did was program all of the float indicators in TradeStation and even devised some of my own based on the ideas in the book. The whole idea of the float turning over at critical turning points turns out to be valid. As Steve Woods points out, float analysis in and of itself is not a solution, but if you pay attention to the trend of the float channels and have some kind of market analysis tool for short-term direction, then it is a gold mine.
An altogether new insight into what moves the stock market
Published by Thriftbooks.com User , 24 years ago
This is a remarkable book for a number of reasons. First, it lucidly presents an entirely innovative look at the meaning of price and volume relationships and how stock prices move in response to changeover in ownership of the "float." Second, it presents an entirely new and eminently useful set of technical indicators that effectively identify stocks that are poised to make significant price moves. Finally, the book is richly detailed with numerous charts that not only illustrate the principles presented but also validate the methodology proposed. I highly recommend this book. It will change your thinking forever about why stock prices change and what moves the market.
Most People Only Use 2/3 of what is Available
Published by Thriftbooks.com User , 24 years ago
This book explains that there is 2 types of stock owners, stupid and smart. Using the author's techniques, you can become one of the smart people and find out when a stock has bottomed--buy up the shares from the stupid people. Once the stock goes up, you can tell where it will peak--you now sell out to the stupid people. I strongly endorse this book for many reasons. Here they are:1. It can help increase your returns2. It uses many graphic aids so you can see what the author is explaining3. The author is a great guy and is willing to help you if you ask him (contact him at FloatAnalysis.com).4. The author spends his own time for you. He created a FREE newsletter that lists possible buy candidates along with their buying point. This newsletter greatly reduces the time it would take you to do alone by many HOURS.Buy this book, read it, and go to FloatAnalysis.com.


