Skip to content
Scan a barcode
Scan
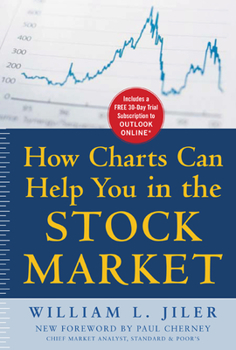
Paperback How Charts Can Help You in the Stock Market (Pb) Book

ISBN: 1265641218

ISBN13: 9781265641214

How Charts Can Help You in the Stock Market (Pb)

Select Format

Select Condition ThriftBooks Help Icon

Recommended

Format: Paperback

Condition: New

$34.61
Save $9.39!
List Price $44.00
50 Available
Ships within 2-3 days

Book Overview

VALUABLE ADVICE FOR INVESTORS OF ALL TYPES FROM STANDARD & POOR'S, TODAY'S MOST TRUSTED RESOURCE FOR RELIABLE INVESTMENT INFORMATION

Standard & Poor's Press brings the impressive knowledge and resources of Standard & Poor's to some of today's most challenging financial issues. Covering subjects from saving for college to technical analysis to risk management, books in the series will give both independent and institutional investors the knowledge they need to dramatically improve their overall financial decisions.

The classic primer on technical analysis, reprinted for a new generation of traders and technicians

As classic and timeless as Graham & Dodd's Security Analysis, William Jiler's How Charts Can Help You in the Stock Market is the must-have primer on technical analysis.

First published in 1962, it was the first book to explain how all investors can use charting to more profitably time both their buys and sells and is globally renowned to this day for helping traders and investors use the tools of technical analysis to increase their profits.

Featuring a new Foreword by the investing experts at Standard & Poor's, this special reprint edition will be an excellent resource for beginners as well as a vital reference for experienced technicians. Technical traders will look to it for:

Tips for removing the mystery from the use of technical analysis Easy-to-understand definitions of technical analysis topics Examples and explanations of essential configurations, patterns, and formations

Customer Reviews

4 ratings

Good Education

If the current round of corporate accounting fraud hasn't awakened you up to the usefulness of charting, maybe this book will. After having tried a pure fundamental analysis approach in my investing for years, someone finally convinced me to look at charts, which I considered to be the same level as reading tea leaves -- au contraire. After spening the past two years studying technical analysis, I am happy to report that this is one of the better books on the subject, and inexpensive, too. This book, along with websites like TradingMarkets.com, will give you a fantastic basis in technical analysis.

Not a gimick stock book--the real deal for TA

You can spend thousands on get rich schemes that are confusing, or dangerous, or far worse.But the TA techniques are the standard and written by a standard in TA.The charts are antiques but the knowledge is as current as today. (E.J. Korvette is one of the charts :)Anything you learn from the book would be confirmed as correct today by an TA professional. And, it is quite readable to boot!

Chart Analysis Overview.....

Great book for beginning investors concerned about the TA side investing. I have owned this book for years and still find myself referring back to it on a constant basis. If you follow the market using charts or would like to start then this book is a must. It is extremely informative on the different techniques, formations and patterns to examine when reading charts. It is easy to follow and the examples are very descriptive. It does not get to technical, yet it maintains a clear, concise & knowledgeable approach to the various explanations. This book has unquestionably broadened my horizons & guided my investing success.

Superb book starting from ground-zero. Time-proven approach

This book is not only an excellent resource for beginner investors, but also a great review and tool for those more experienced. Originally written in the '60's, this book has stood the test of time due to its clarity and usefulness. The explanations are very easy to understand. The best part of this book are the many charts that clearly identify the patterns discussed. The system offers a "sell philosophy" as well, something that most other investment systems and news services do not (effectively) offer. Chapter's 8-11 get a little esoteric, and I recommend them only for those really into Chartology. But don't forget the end of the book, as some of the best material is in Chapters 12-17. His explanation of the 200-day moving average is beautiful. I've given this book to many people as a gift and I keep a copy of it for reference.
Copyright © 2025 Thriftbooks.com Terms of Use | Privacy Policy | Do Not Sell/Share My Personal Information | Cookie Policy | Cookie Preferences | Accessibility Statement
ThriftBooks ® and the ThriftBooks ® logo are registered trademarks of Thrift Books Global, LLC
GoDaddy Verified and Secured