
Math Fundamentals 4 - Data Analysis Probability: a QuickStudy Laminated Reference Guide
No Customer Reviews

Essential core elements of mathematics to support early learning, continued development, and as a reference to review during and after building a strong foundation. Seeing a broad overview and how the details make the math possible in just 6 pages can melt away some math phobia and will strengthen skills and grades. Written and tested in a classroom over many years, two teachers came to us with this reference they used with their students. A math textbook authoring group then expanded the series. With experts in the classroom and in textbooks developing the content, don't pass up this 6 page laminated, inexpensive tool with the power to support the core areas of math students struggle with. Check other titles in the 5-guide series for the areas of support most needed.
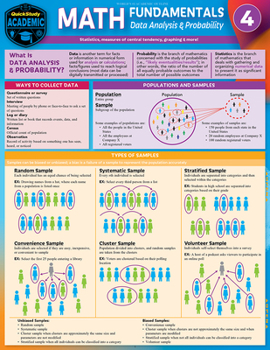
6 page laminated guide includes: Ways to Collect DataPopulations & SamplesTypes of SamplesRandom SampleConvenience SampleSystematic SampleCluster SampleStratified SampleVolunteer SampleMeasures of Central TendencyMeasures of SpreadRangeInterquartile Range (IQR)When to use Measures of Center & SpreadSymmetric Distribution (also called Normal Distribution)Negatively Skewed Distribution (also called Left Skewed Distribution)Positively Skewed Distribution (also called Right Skewed Distribution)Interpretation of GraphsWays to Prevent Misinterpretation of GraphsGraphing DataChecklist for Making GraphsData DisplaysPictograph, Frequency Table, Tally MarksBar Graph, Double & Multiple Bar Graphs Stacked Bar Graph Two-Way Frequency & Relative Frequency TableCircle Graph (also called Pie Chart) & Steps to Make Circle GraphScatter Plot & Steps to Make a Scatter PlotBox-and-Whisker Plot & Steps to Make a Box-and-Whisker PlotHistogram & Steps to Make a HistogramDistributions in HistogramsLine Graph & Line PlotStem-and-Leaf PlotMultiple Line Graph Double Stem-and-Leaf PlotInterpreting StatisticsInterpolation / ExtrapolationNormal DistributionVenn DiagramTo determine if a set of data has any outliers: MatrixDisjoint SetsInterpreting the Venn DiagramProbability
6 page laminated guide includes: Ways to Collect DataPopulations & SamplesTypes of SamplesRandom SampleConvenience SampleSystematic SampleCluster SampleStratified SampleVolunteer SampleMeasures of Central TendencyMeasures of SpreadRangeInterquartile Range (IQR)When to use Measures of Center & SpreadSymmetric Distribution (also called Normal Distribution)Negatively Skewed Distribution (also called Left Skewed Distribution)Positively Skewed Distribution (also called Right Skewed Distribution)Interpretation of GraphsWays to Prevent Misinterpretation of GraphsGraphing DataChecklist for Making GraphsData DisplaysPictograph, Frequency Table, Tally MarksBar Graph, Double & Multiple Bar Graphs Stacked Bar Graph Two-Way Frequency & Relative Frequency TableCircle Graph (also called Pie Chart) & Steps to Make Circle GraphScatter Plot & Steps to Make a Scatter PlotBox-and-Whisker Plot & Steps to Make a Box-and-Whisker PlotHistogram & Steps to Make a HistogramDistributions in HistogramsLine Graph & Line PlotStem-and-Leaf PlotMultiple Line Graph Double Stem-and-Leaf PlotInterpreting StatisticsInterpolation / ExtrapolationNormal DistributionVenn DiagramTo determine if a set of data has any outliers: MatrixDisjoint SetsInterpreting the Venn DiagramProbability
Format:Cards
Language:English
ISBN:1423247272
ISBN13:9781423247272
Release Date:November 2021
Publisher:Quickstudy Reference Guides
Length:6 Pages
Weight:0.90 lbs.
Dimensions:0.4" x 8.3" x 11.0"
Customer Reviews
0 rating
Copyright © 2025 Thriftbooks.com
Terms of Use | Privacy Policy | Do Not Sell/Share My Personal Information | Cookie Policy | Cookie Preferences | Accessibility Statement
ThriftBooks ® and the ThriftBooks ® logo are registered trademarks of Thrift Books Global, LLC
ThriftBooks ® and the ThriftBooks ® logo are registered trademarks of Thrift Books Global, LLC
